Vienzo – Professional Infographic Statistic

About the Product
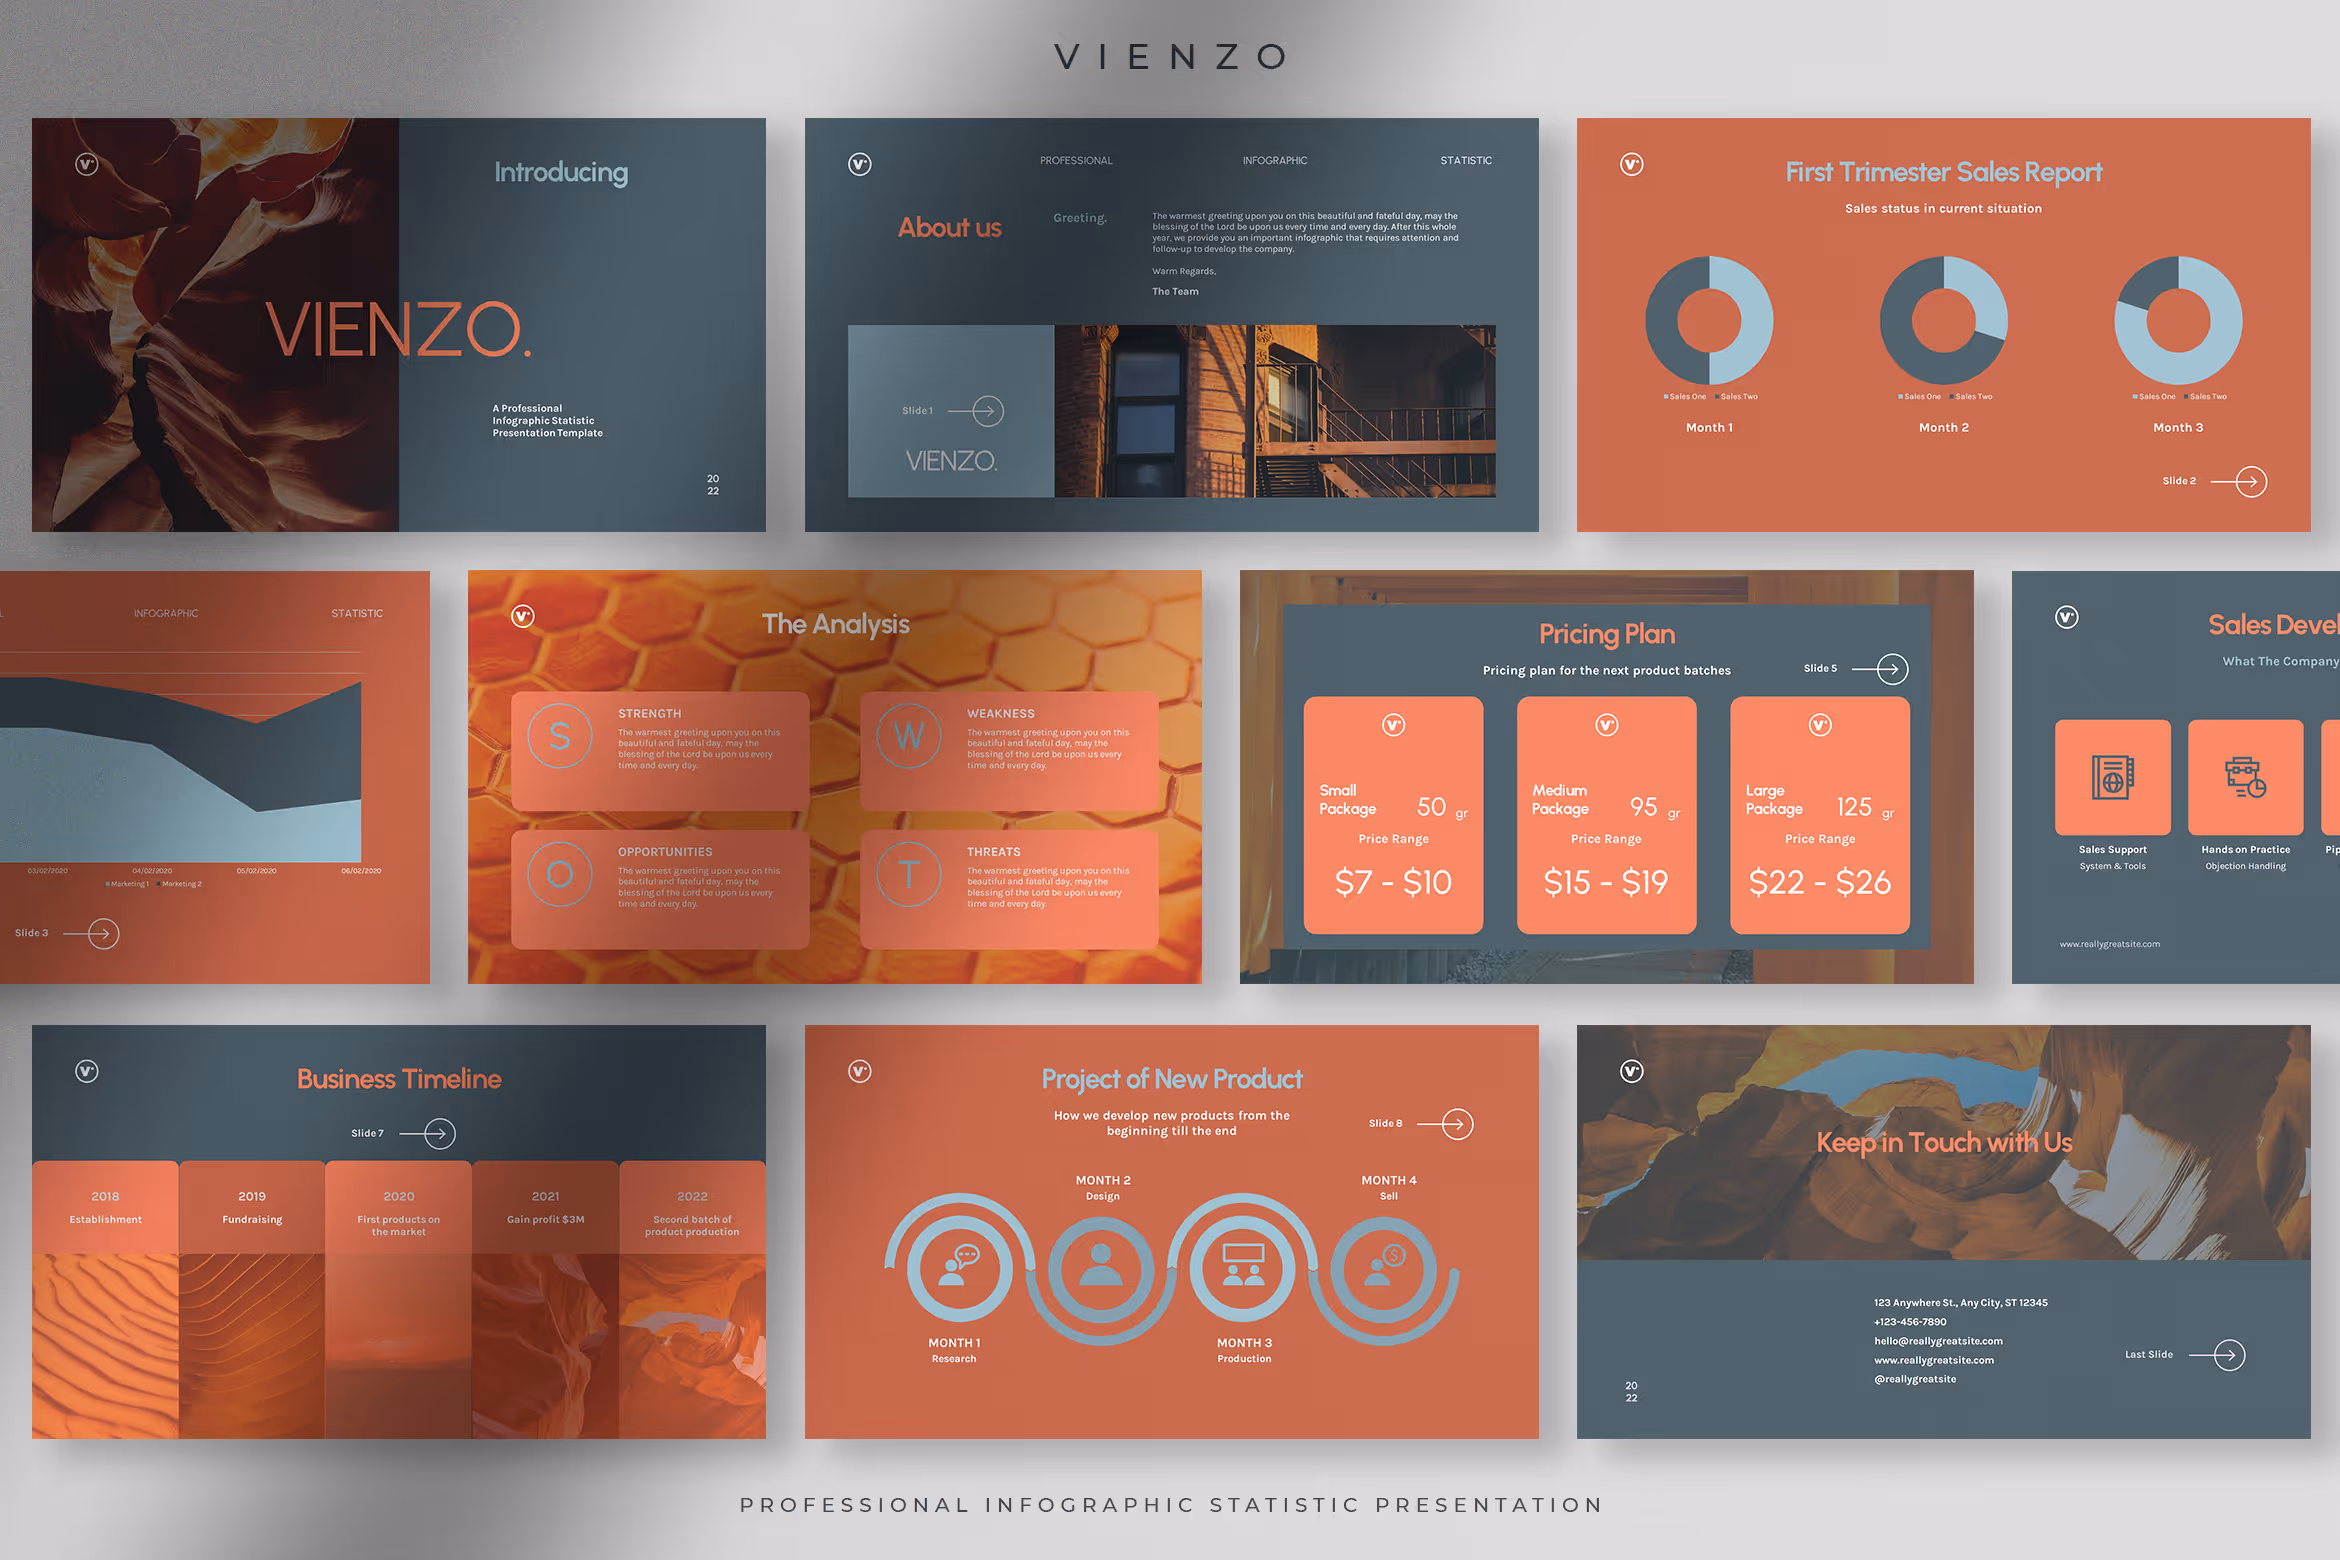
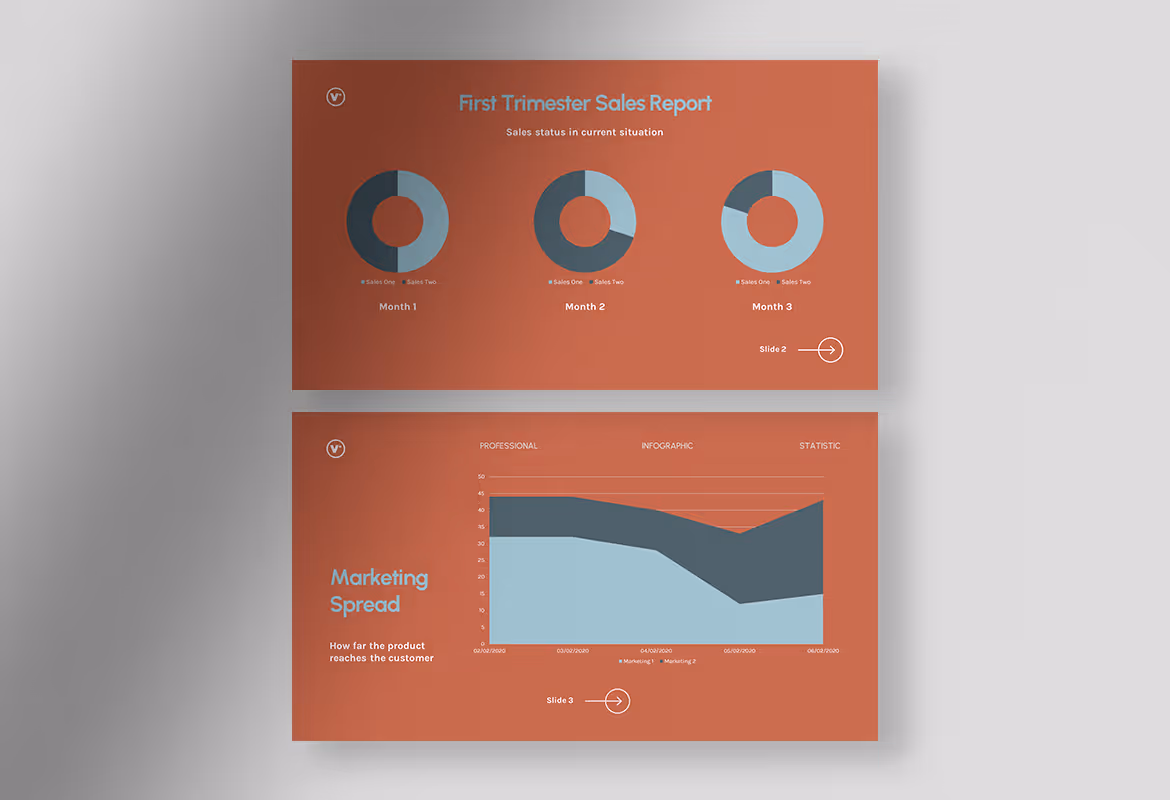
To make an actual report on the company’s development, it does not only have to be explained in the form of words but also presentations in the form of graphs and charts. Charts and graphs can support your explanation well because the data shows in your statistic presentation are based on facts on the field. To make this statistic presentation more outstanding and eye-catching use Vienzo, a solid ground professional infographic statistic presentation template. It is perfect for your company, corporate, start-up, entrepreneur, professional, or other businesses you manage.
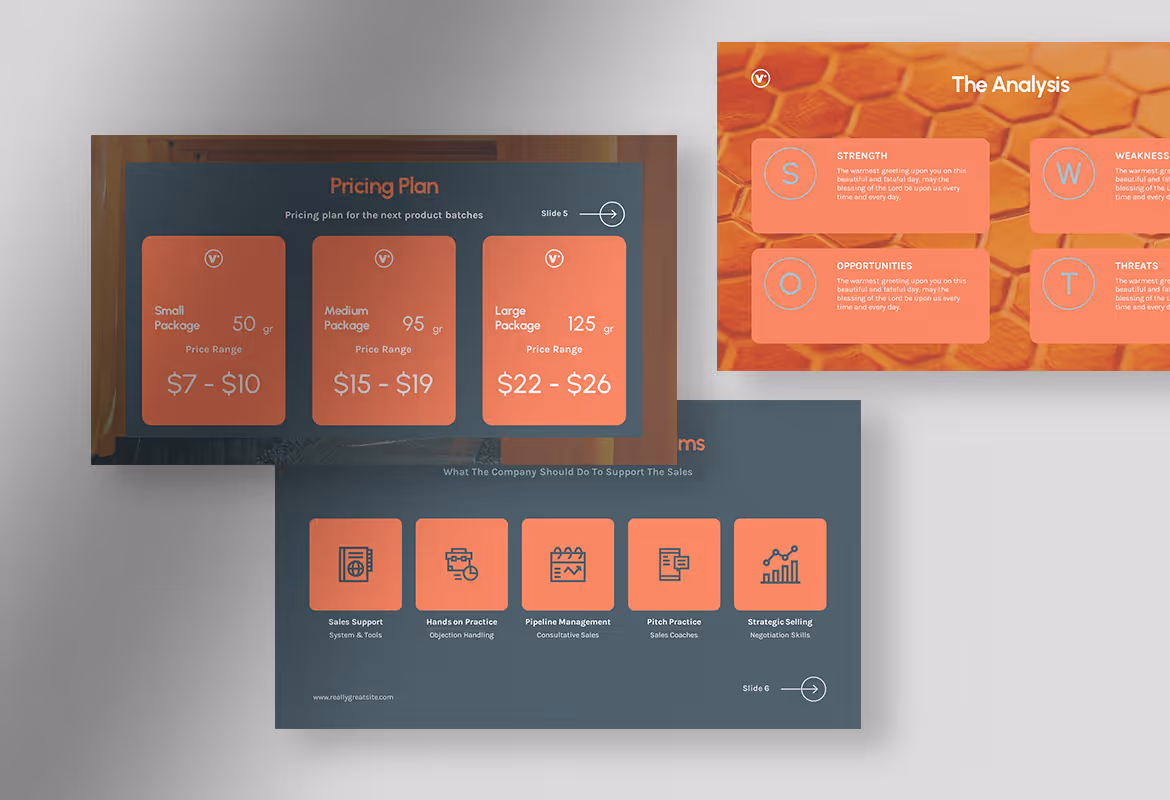
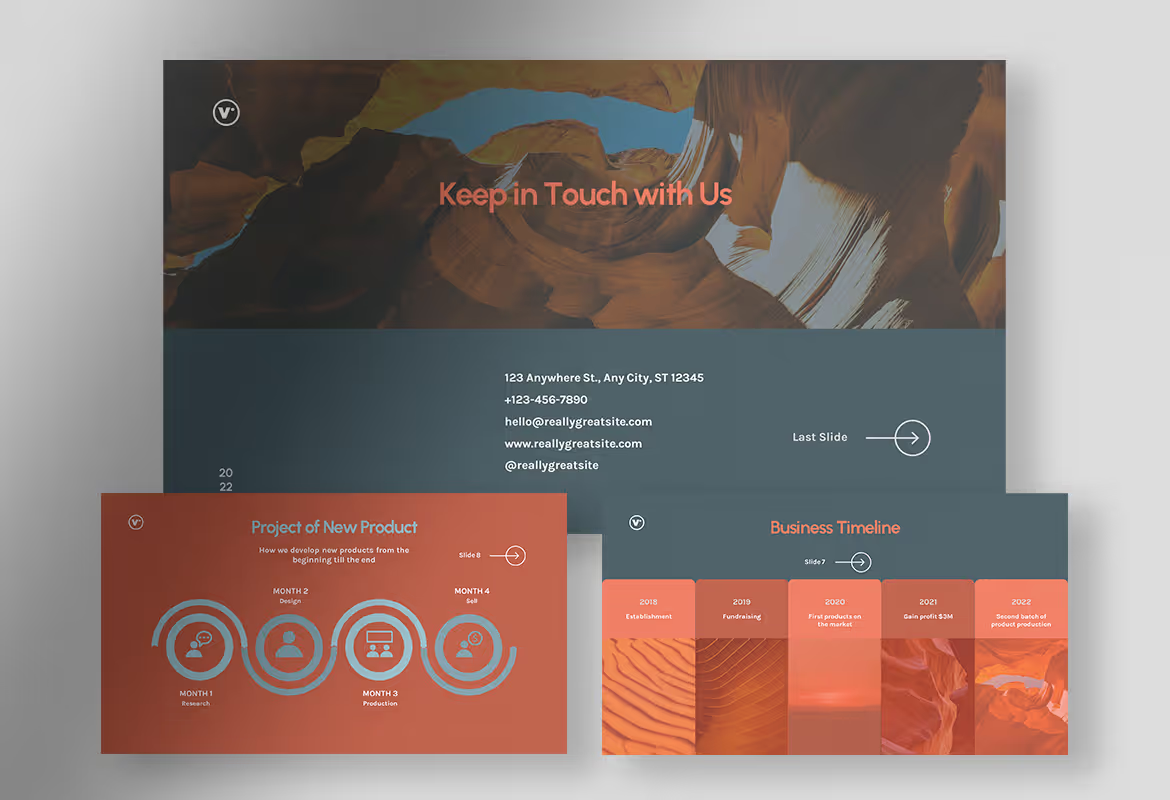
With the combination of terracotta and gray in the background color, it gives a solid and firm appearance that can convince not only your teammate or supervisor but also the director boards, clients, partners, even customers. This template also provides you with various charts and graphs with a modern touch so your infographic statistic presentation can keep the audience’s eyes on your presentation. Thus, this template will be suitable for your annual report, marketing report, progress report or any other statistic presentation.
Vienzo, a solid ground professional infographic statistic presentation template
Help documentation in a PDF file is included in the package to assist you in editing the template. But, if you find any difficulties or issues that Help cannot cover, or you have any questions and inquiries regarding this product, you are always welcome to contact our support team at any time of your convenience.
Details of what you get:
- PPTX file
- PPT file
- 1 Help documentation
Features:
- 10 unique slides
- PPT and PPTX
- Based on Master slide
- Easy to edit text and colors
- Use free fonts from Google Fonts
- Support Microsoft PowerPoint
- 16:9 Wide screen ratio
- Picture Placeholder
- All graphics re-sizable and editable
Style:
- Simple
- Modern
- Minimalist
Colors:
- Gray
- Terracotta
- Orange
Suitable For:
- Annual Report
- Sales Report
- Marketing Report
- Statistic
Perfect For:
- Company
- Corporate
- Start-up
- Professional
- Other Businesses